Airports and airlines run on where things are: aircraft on approach, on the runway, on stand; tugs, fuel and baggage around them; a fleet spread across the world. Icon Map puts all of it on one live, interactive map, inside the Power BI reports and Microsoft Fabric workspaces you already use.
Real traffic at London Heathrow, recorded from adsb.lol · 3D aircraft in Icon Map for Fabric
Operations you can see
Every movement, in context
Flight tracks, stand allocations, turnaround milestones, ground vehicle telemetry and schedules already sit in your data platform. Icon Map shows them where they happen, so an operations team sees the airfield, not a table: which runway is in use, who is holding, how long departures are taxiing, where the stands are filling up.
Build operational and network reports in Power BI with Icon Map Pro, or bring live feeds, 3D aircraft and playback together in Microsoft Fabric with Icon Map for Fabric.
True-scale 3D aircraftAirliners and ground vehicles as 3D models that pitch, bank and turn as they really move, in Icon Map for Fabric.
Live, or played backStream positions through Eventstream as they happen, or replay any period with a time slider to see how the day unfolded.
Analytics beside the mapMovements, runway use, taxi times and stand occupancy as measures, filtering with the map in the same report.
From one stand to the networkThe same map zooms from a single stand to a global fleet on a 3D globe, with great-circle routes.
Airport operations · London Heathrow
A digital twin of the airfield
Real traffic at Heathrow, recorded from public ADS-B data and replayed as 3D aircraft: arrivals on the approach to 27L, departures rolling on 27R, aircraft taxiing and on stand, with tugs, fuel and baggage around them. Click any aircraft to follow it.
Aircraft positions: ADS-B data recorded around London Heathrow from adsb.lol (open data under the ODbL), replayed with each aircraft interpolated between its reported positions, speeds and tracks, and snapped to the taxiway centerlines on the ground. Tails are painted in each airline's colors (simple designs, not the airlines' own tail art); trails show arrivals and departures. The ground vehicles are simulated around the real aircraft movements. The airfield (runways, taxiways, aprons, stands and terminals) is drawn from Icon Map's built-in basemap data. 3D models, playback and the time slider are features of Icon Map for Fabric.
How it works
From feeds to a living airfield
Stream the positions
ADS-B and multilateration feeds, ground vehicle telematics and stand systems flow into Fabric through Eventstream, or sit in your Lakehouse and Warehouse for history.
Eventstream · Eventhouse · OneLake
Add the airfield
Runways, taxiways, aprons and stands from the basemap or the Icon Map Catalog, your own stand plans and CAD, and 3D models for every aircraft type and vehicle.
Built-in basemaps · Icon Map Catalog · your models
Run the operation
Watch the airfield live or replay any period, follow an aircraft, and measure runway use, taxi times and stand occupancy with every chart in the report filtering together.
Icon Map for Fabric · Icon Map Pro
Across airports and airlines
Where aviation teams use Icon Map
Airfield operations
Arrivals, departures and ground movements on one map, with runway use, holding and taxi times measured as they happen.
Stands and turnarounds
Stand occupancy, turnaround milestones and delays by stand and pier, with the ground handling fleet around each aircraft.
Ground support equipment
Track tugs, fuel bowsers, buses and baggage tractors, see utilization by area, and spot vehicles where they should not be.
Airline network and fleet
Routes as great circles on a 3D globe, sized by passengers or revenue, with the fleet's positions and utilization beside them.
On-time performance
Map delay by origin, route, runway and stand, and drill from the network to the turnaround that caused it.
Noise and environment
Flight tracks against noise monitors, residential areas and the population around the airport, from your data and the Icon Map Catalog.
Safety and security
Restricted zones, runway incursions and incident locations in spatial context, for investigation and regulatory reporting.
Terminals and passengers
Passenger flows, queues and retail across terminal floors, alongside the airside operation that drives them.
Why Choose Icon Map?
Our customer success stories
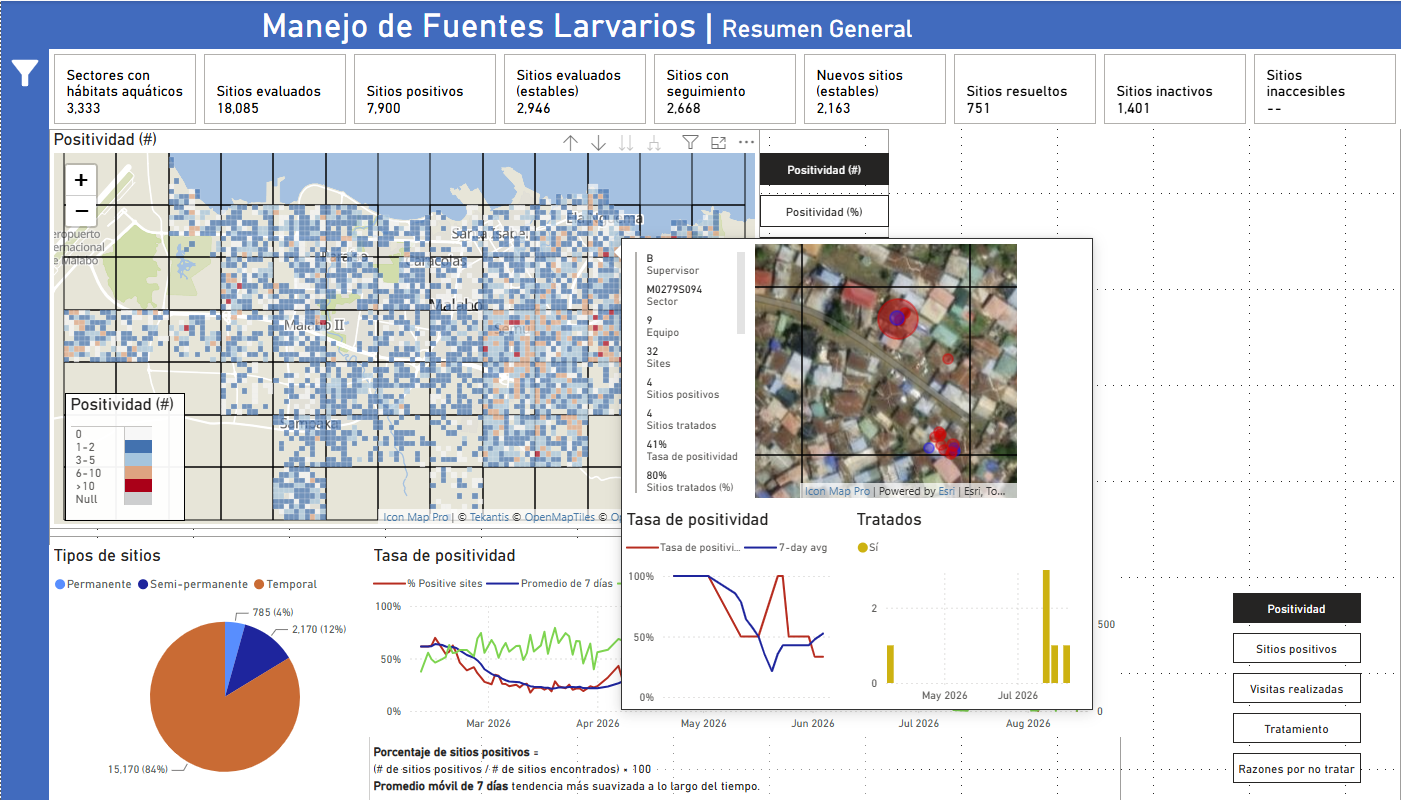
Bringing Malaria Data to Life: How MCD Global Health Uses Icon Map Pro to Power Field Decisions in Equatorial Guinea
MCD Global Health is a public health nonprofit headquartered in Maine, working across more than 50 countries to design and implement health programmes that genuinely change lives. Their international work spans malaria, cervical cancer, health systems strengt…
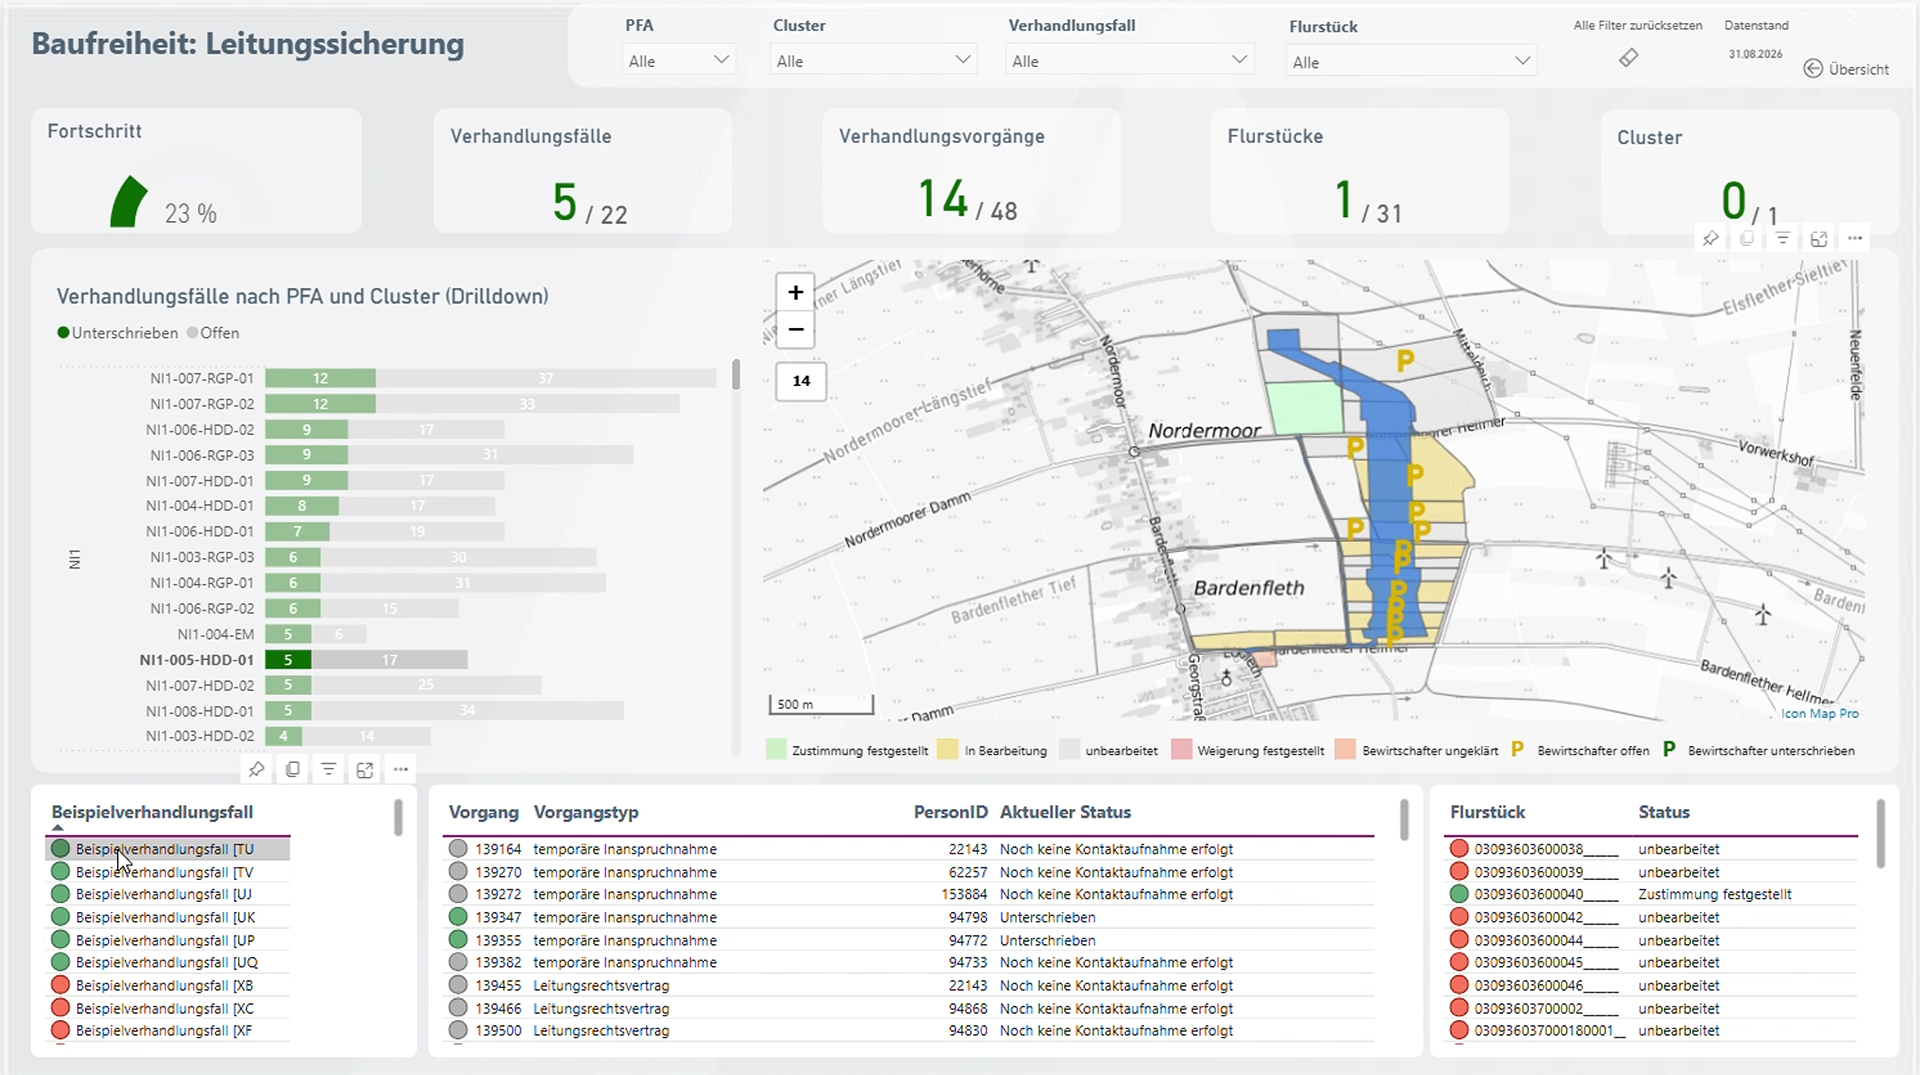
Amprion: Bringing Large-Scale Transmission Infrastructure onto a Single Map
Amprion is one of Germany’s four transmission system operators, responsible for operating and expanding a critical part of Germany’s high-voltage electricity grid. Among its major infrastructure programmes is the Rhein-Main-Link, a planned underground HVDC c…
Enhancing Fiber Deployment and Commercialization with Icon Map Pro at Orange Concessions
Orange Concessions is the leading public-private fiber network operator in rural France. Through long-term public service delegation contracts, it manages a rapidly expanding network infrastructure designed to bring high-speed broadband access to underserved…
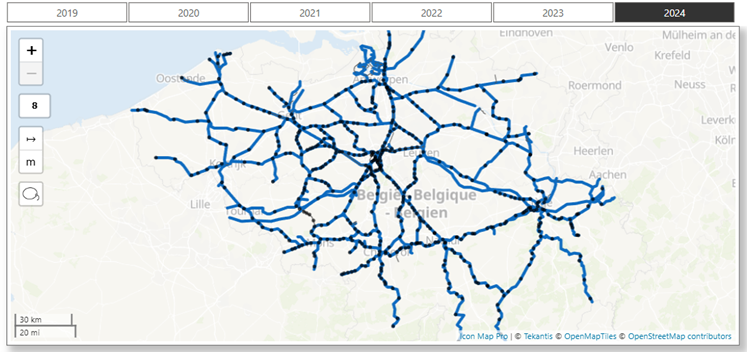
Transforming Rail Safety: The Power of Location Intelligence in Action at SNCB
Safety is a cornerstone of SNCB’s operational strategy. As Belgium’s national railway operator, SNCB places significant emphasis on the safety and security of both passengers and staff. CEO Sophie Dutordoir recently stated that all employees' work "deserves r…
Optimizing Christmas Eve: How Santa Uses Icon Map to Put Every Child on the Map
North Pole Logistics is the exclusive global operator responsible for delivering presents to children who celebrate Christmas. Operating from a single distribution center at the North Pole, the organization must reach more than 900 million homes in one extend…
Build operational and network reports in Power BI with Icon Map Pro, or bring live feeds, 3D aircraft and playback together in Microsoft Fabric with Icon Map for Fabric.
PlayPauseOn the groundTaxiingOn standArrivingDepartingOn the groundOther trafficLandingDepartinglanded {r}departed {r}No movements yet: press play.Show the map full screenThis live map could not load. Please check your connection and refresh the page.Use Ctrl + scroll to zoom the mapUse ⌘ + scroll to zoom the mapUse two fingers to move the map