Location intelligence inside Power BI turns complex oil & gas data into actionable insight for safer operations, efficient production, and stronger ESG performance.
Operations & Asset Performance
Leverage advanced geospatial visualization to improve production outcomes, predict failures earlier, and strengthen safety across the enterprise.
Production Optimization Dashboards
Plot live well‑head, reservoir, and subsea‑sensor data on Icon Map to highlight under‑performing wells, choke settings, and water‑cut hotspots. Enable engineers to act within hours, not days.
Predictive Maintenance
Overlay corrosion, vibration, and thickness‑measurement data on pipelines, jackets, and topsides to predict failures. Target campaigns only where risk is highest to slash fly‑outs and downtime.
HSE Risk & Emergency Response
Bring together real‑time incident layers such as gas detection, weather, and crew location to support rapid muster, spill modeling, and situational awareness—reducing response time and exposure.
The Basin and Its Weather, Live in Icon Map
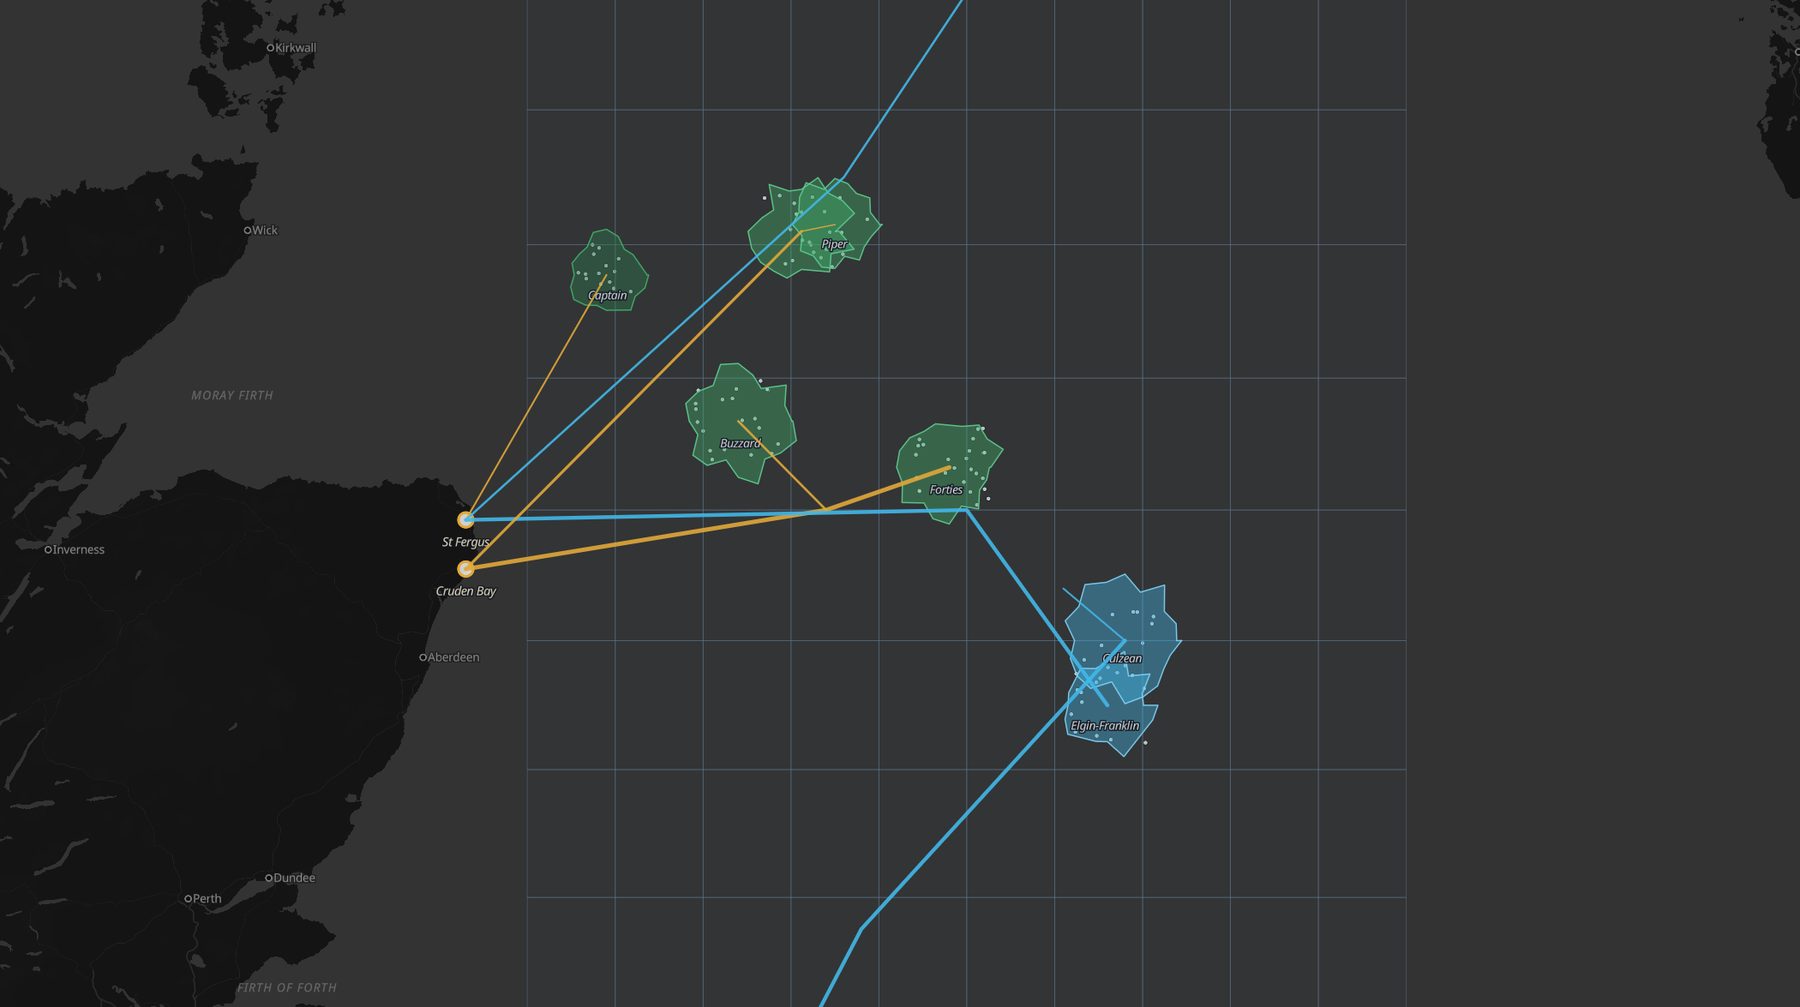
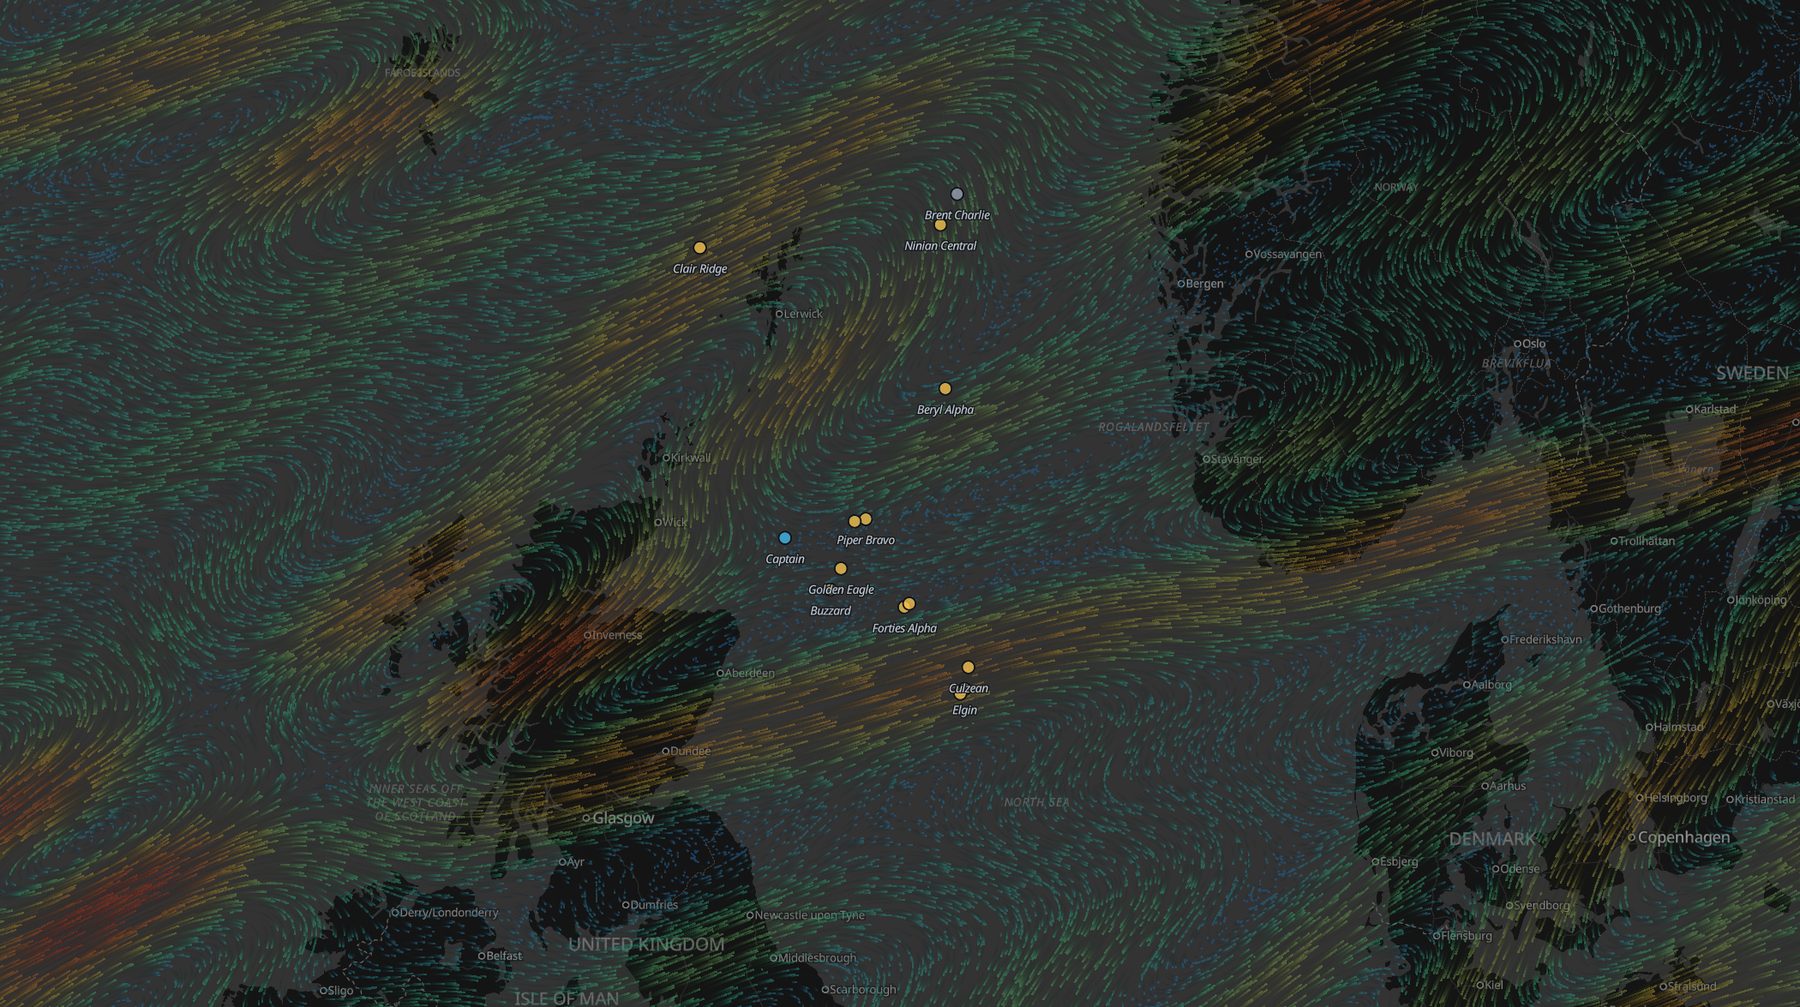
Real Icon Map renders of an offshore basin - blocks, fields, wells, pipelines, terminals - and the same assets under live weather. Infrastructure is ordinary geometry and point layers bound to Lakehouse tables; the weather is live model data fetched anonymously in the browser, with no API keys and nothing about your assets sent anywhere.
The basin on one map. License blocks as a reference lattice, field outlines colored by type - oil, heavy oil, gas condensate, decommissioning - well stock inside each field, and the export pipeline system running to St Fergus, Cruden Bay, and Teesside, width by capacity. Every element binds to your production, integrity, and reserves tables and cross-filters the charts beside it. Rendered live in Icon Map.The same assets in today's weather. Live animated surface wind from the latest GFS run over the platform stock - the shipped weather layers add significant wave height with an animated sea, pressure isobars, and forecast scrubbing for lifting and crew-transfer windows. Fetched free and anonymously from open model data. Rendered live in Icon Map.
Add inspection defects along pipelines, chainage-colored integrity segments, subsurface well paths as 3D lines, or reserves as field-level measures - operations, integrity, and planning from one governed report. Icon Map for Microsoft Fabric is in private preview - join the wait list to run these analyses on your own data.Icon Map for Microsoft Fabric is generally available - start a free 30-day trial from inside Fabric or buy a plan to run these analyses on your own data. The same map, chart, and cross-filter machinery is available today in Icon Map Pro for Power BI.
Field and pipeline geometry is illustrative; the geometry, labeling, live weather, and rendering engines are the shipped product.
Logistics, Sustainability & Platform
Optimize marine logistics, monitor emissions performance, and maximize returns on your existing Microsoft investments.
Marine Logistics & Fuel Efficiency
Track supply vessels, helicopters, and cargo flows against met‑ocean data. Reveal idle steaming, optimize trim and speed, and lower cost per barrel.
Environmental & Emissions Monitoring
Combine satellite flare‑imaging, methane‑sat data, and asset GIS to pinpoint leaks, rank sources, and evidence ESG performance in Power BI scorecards.
Leverage Existing Investments
Use your existing Power BI and Microsoft data platform infrastructure to avoid costly additional GIS software. Achieve up to 5× cost reduction while removing usage limits with capacity‑based licensing.
Why Choose Icon Map?
Our customer success stories
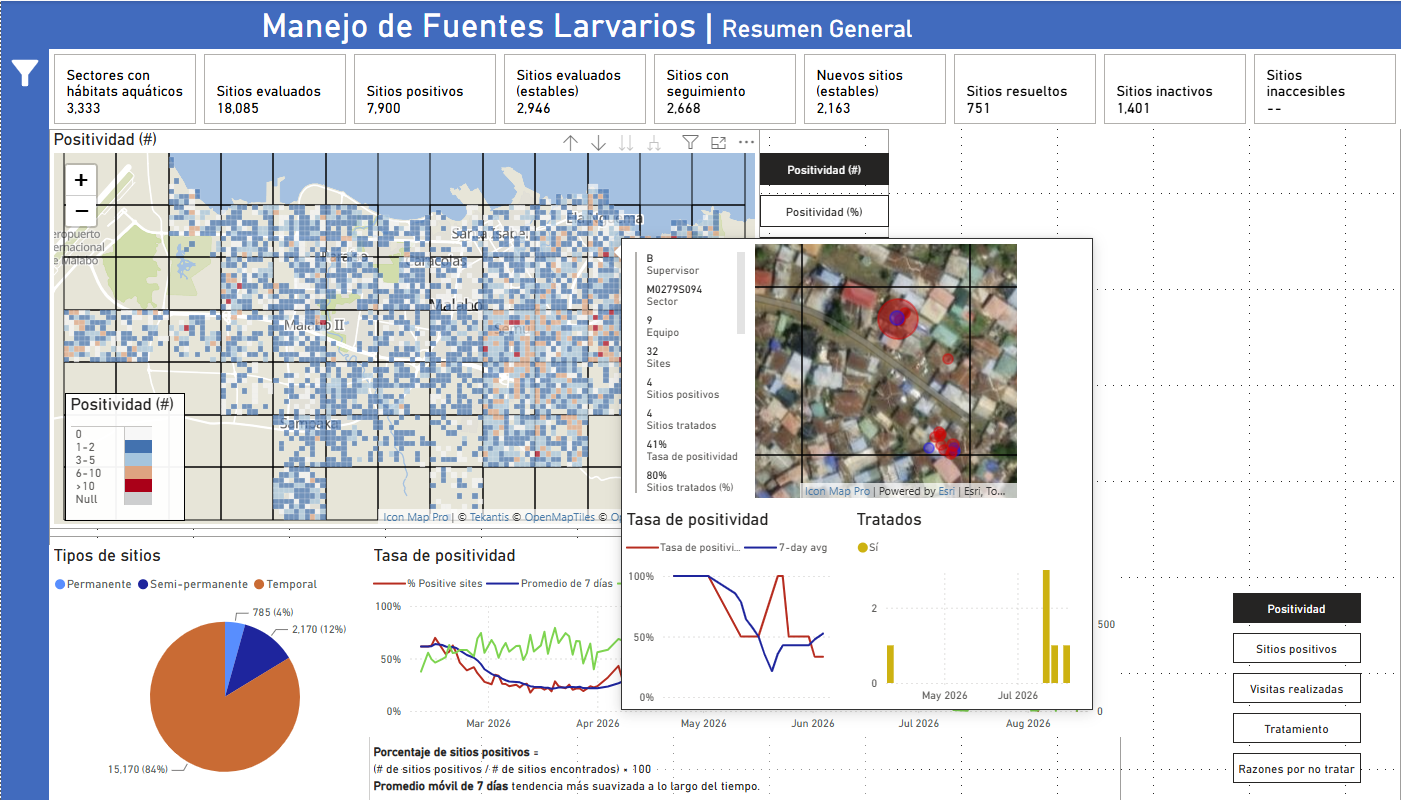
Bringing Malaria Data to Life: How MCD Global Health Uses Icon Map Pro to Power Field Decisions in Equatorial Guinea
MCD Global Health is a public health nonprofit headquartered in Maine, working across more than 50 countries to design and implement health programmes that genuinely change lives. Their international work spans malaria, cervical cancer, health systems strengt…
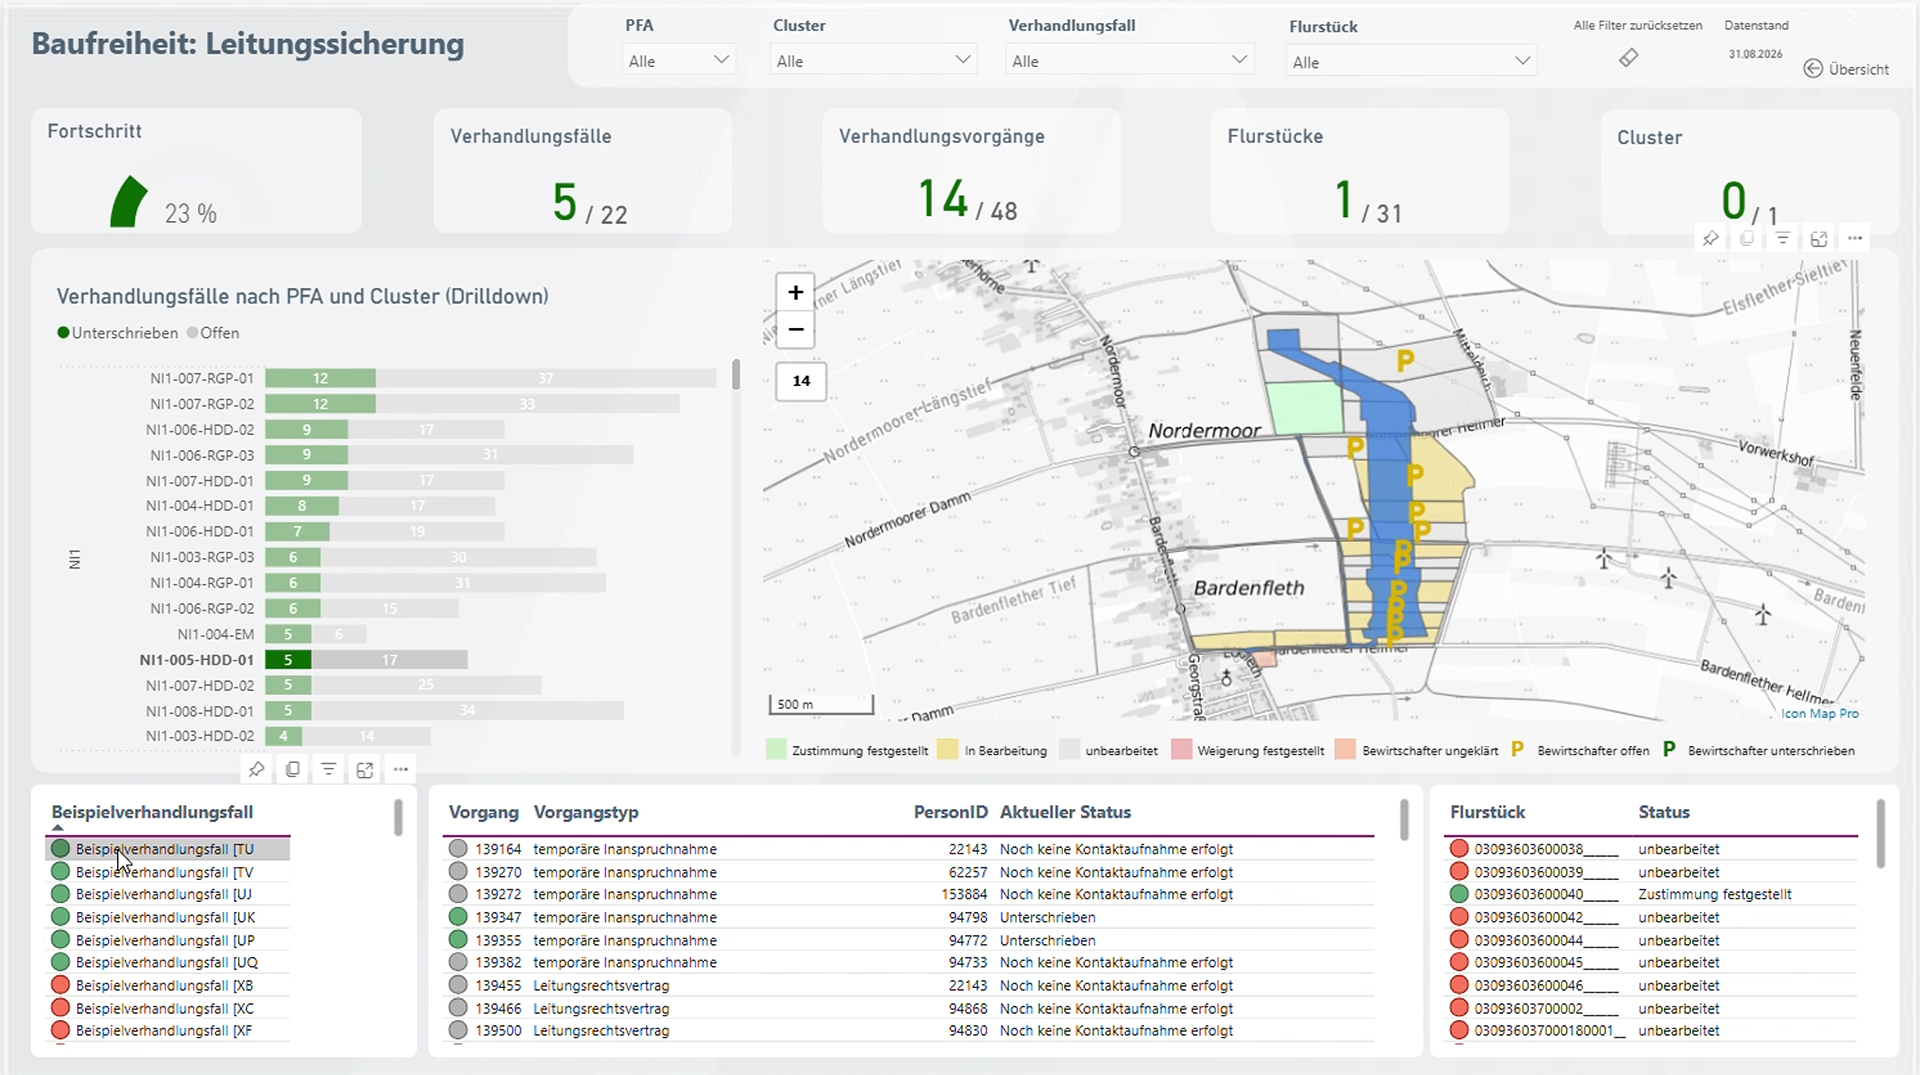
Amprion: Bringing Large-Scale Transmission Infrastructure onto a Single Map
Amprion is one of Germany’s four transmission system operators, responsible for operating and expanding a critical part of Germany’s high-voltage electricity grid. Among its major infrastructure programmes is the Rhein-Main-Link, a planned underground HVDC c…
Enhancing Fiber Deployment and Commercialization with Icon Map Pro at Orange Concessions
Orange Concessions is the leading public-private fiber network operator in rural France. Through long-term public service delegation contracts, it manages a rapidly expanding network infrastructure designed to bring high-speed broadband access to underserved…
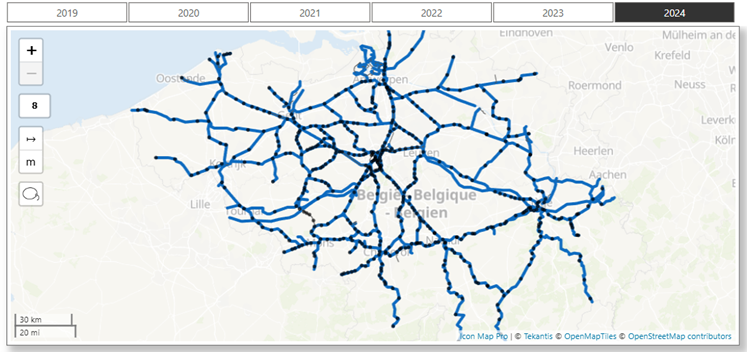
Transforming Rail Safety: The Power of Location Intelligence in Action at SNCB
Safety is a cornerstone of SNCB’s operational strategy. As Belgium’s national railway operator, SNCB places significant emphasis on the safety and security of both passengers and staff. CEO Sophie Dutordoir recently stated that all employees' work "deserves r…
Optimizing Christmas Eve: How Santa Uses Icon Map to Put Every Child on the Map
North Pole Logistics is the exclusive global operator responsible for delivering presents to children who celebrate Christmas. Operating from a single distribution center at the North Pole, the organization must reach more than 900 million homes in one extend…