Leverage your existing Power BI and Microsoft data platform infrastructure to bring advanced geospatial insights to rail operations without costly GIS licensing. Break down silos and enable reports and data sharing with partners and the public.
Leverage Existing Investments
Utilize your existing Power BI and Microsoft data platform infrastructure, eliminating the need for costly additional GIS software such as ArcGIS. Eliminate siloed access to location intelligence with organization-wide unlimited licensing, enabling seamless sharing of reports and data with partners and the general public.
Asset Monitoring Dashboards
Visualize near real-time or historic location data on track conditions, rolling stock health, and infrastructure wear. Create holistic dashboard views to optimize maintenance schedules and reduce delays and costs.
Delay Attribution Analysis
Pinpoint recurring delay hotspots and contributing factors such as congestion or infrastructure faults. Replay journeys to show cascading effects and allocate resources effectively to reduce compensation payouts.
Environmental Factors
Analyze environmental factors affecting the rail network. Integrate 3D terrain and soil types with weather patterns and flood-prone areas to refine risk assessments.
Integrate external datasets such as National Tree Map for tree locations along tracks, enriched with metrics like height and species, to assess storm risks.
Health and Safety Monitoring
Visualize incidents across the rail network from high-level trends to station-level insights. Identify issues inside buildings or across the network, such as near-misses at level crossings.
Public Behavior Analysis
Analyze passenger movement and flows within stations and on trains using in-house data and external sources to identify high-risk hotspots and optimize crowd management.
See the Railway, Live in Icon Map
Real Icon Map renders built from ordinary tables - the track network, its condition, and who can reach it. The walking catchments are computed client-side in the browser on Icon Map's own routing engine, so station and passenger data never leaves your tenant.
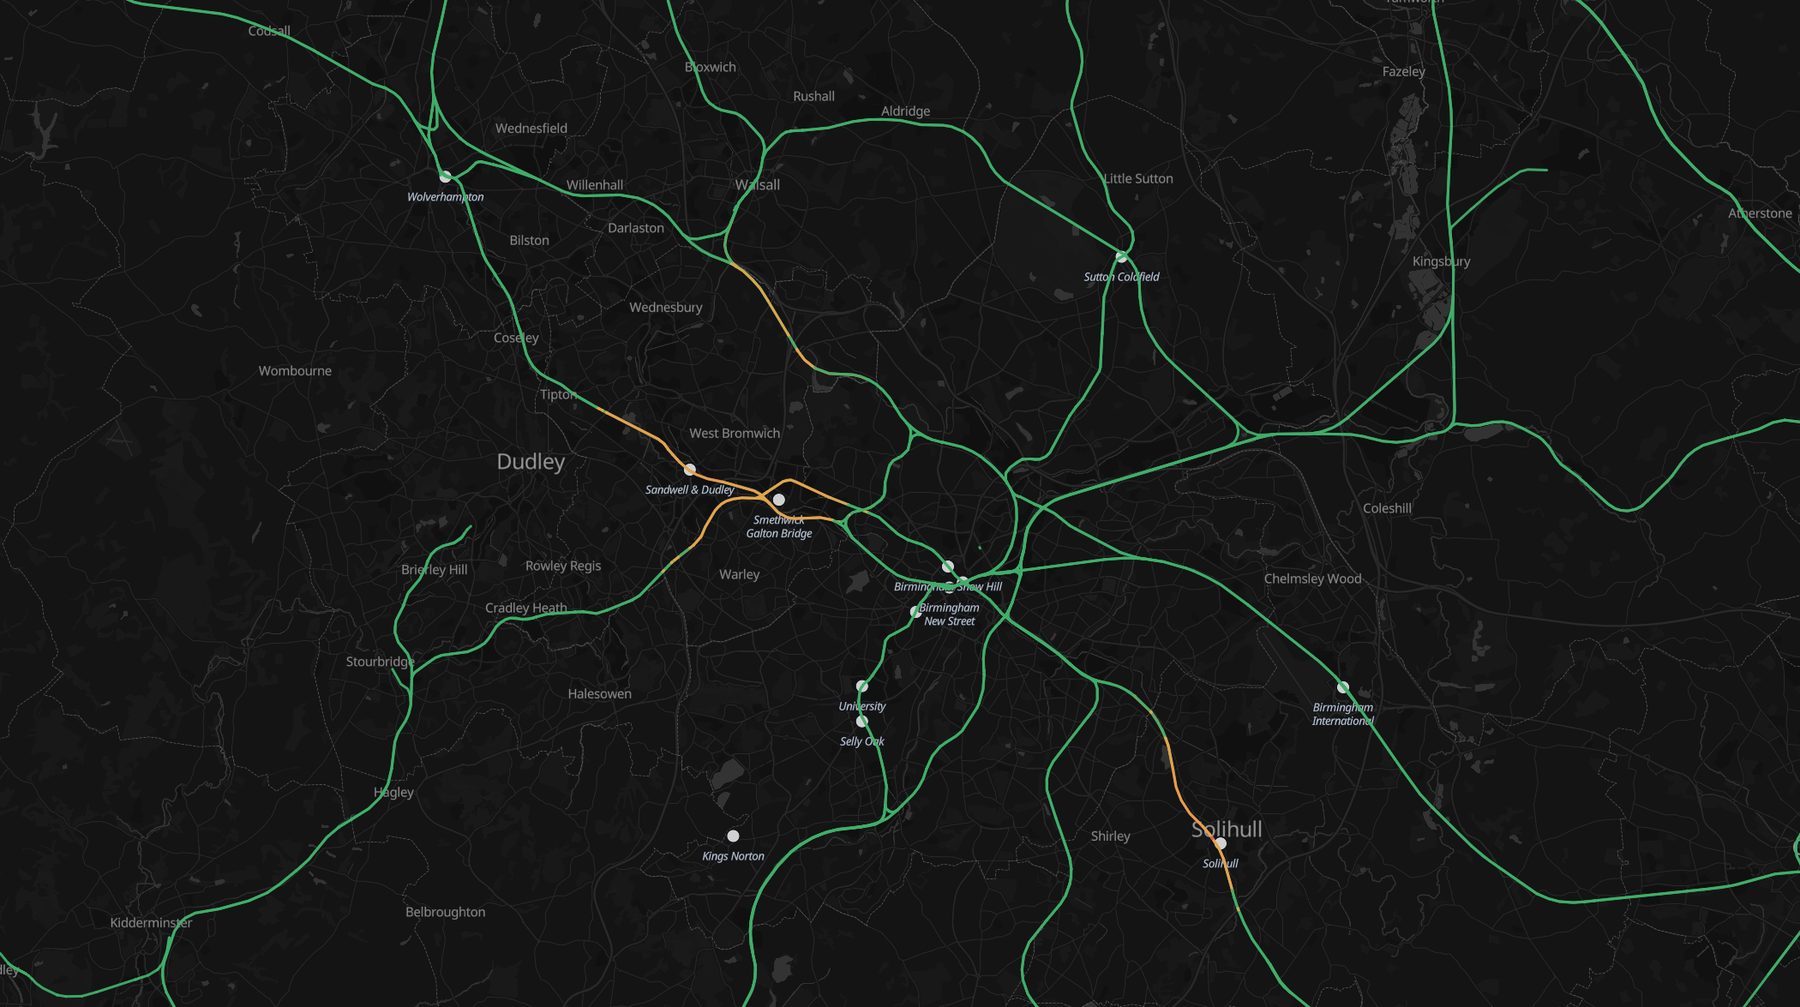
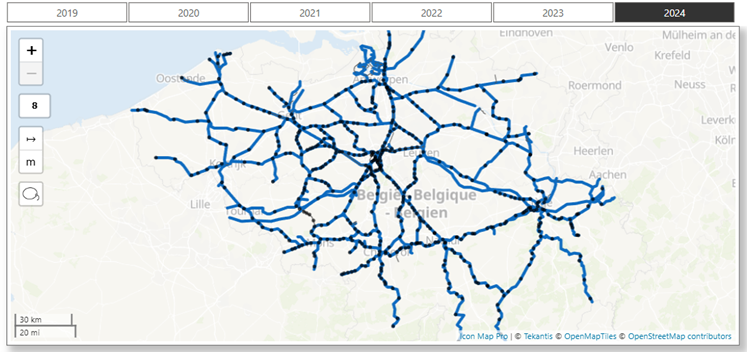
The network itself, colored by condition. Real track geometry with every segment colored by an asset-condition score - the two amber-red corridors are the renewal backlog, and clicking a segment cross-filters its inspection history. Swap the measure for delay minutes, temporary speed restrictions, or possession plans. Rendered live in Icon Map.
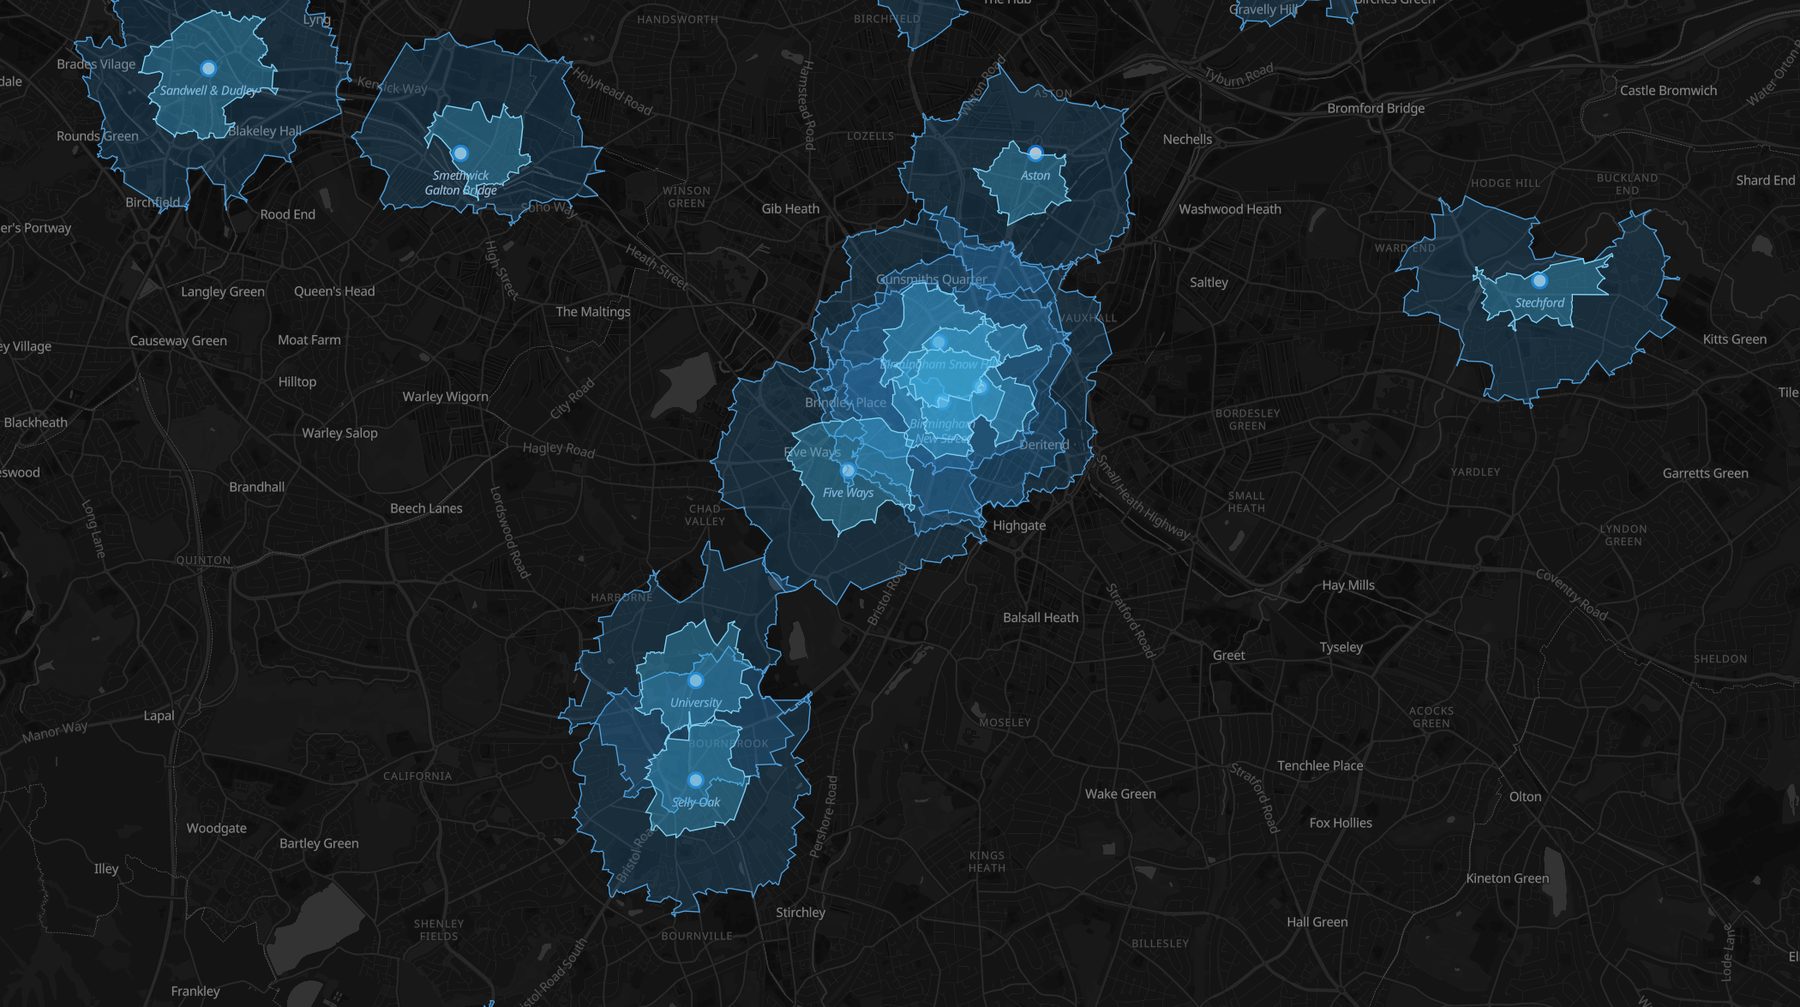
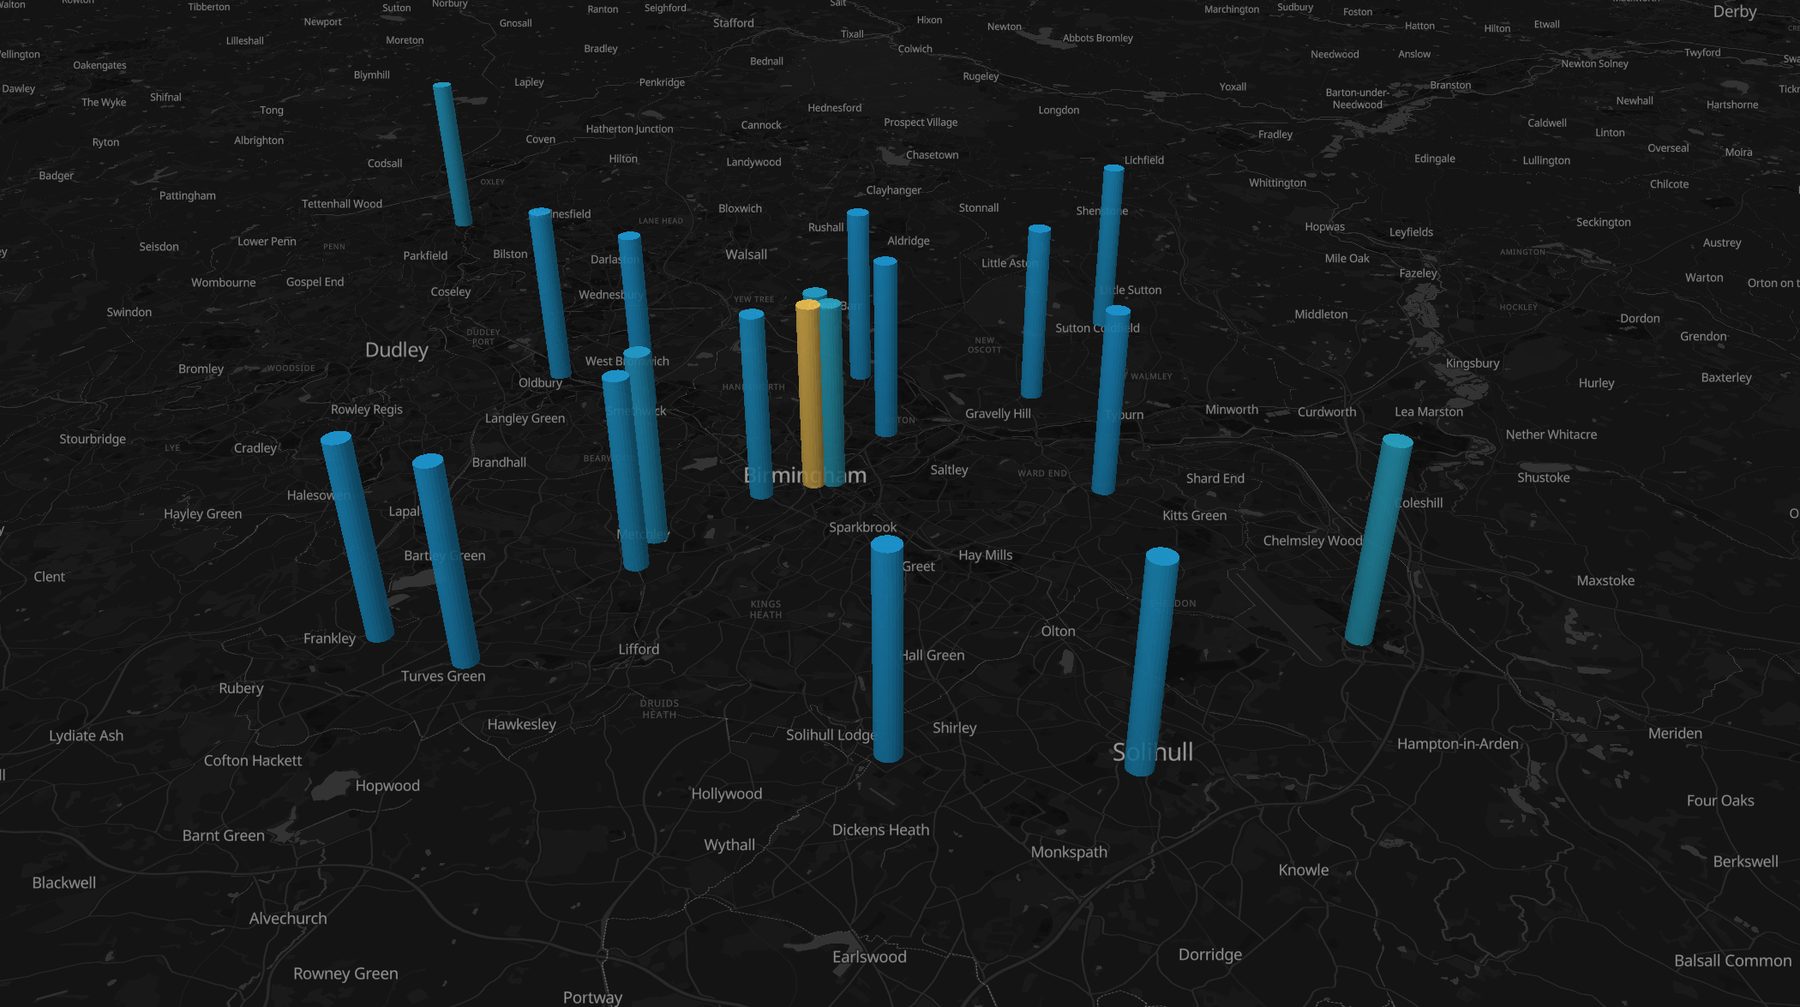
Station access on foot. 10- and 20-minute walking catchments computed over the real street network, client-side - severance from rivers and railways falls out naturally.Usage in three dimensions. Annual entries and exits as 3D columns - the interchange hierarchy at a glance, each column clicking through to its KPI charts.
Add a live feed and trains move along the same network with trails and playback; bind possession plans and the map becomes the weekly access brief. Icon Map for Microsoft Fabric is in private preview - join the wait list to run these analyses on your own data. The same map, chart, and cross-filter machinery is available today in Icon Map Pro for Power BI.
Condition scores are synthetic for demonstration; the network geometry, routing, and rendering engines are the shipped product.
Asset Monitoring
Icon Map leverages GPU-enhanced visualization to render hundreds of thousands of data-bound objects smoothly, enabling macro and micro geographical insights that were not previously possible.
Real-time Condition Monitoring
Track rolling stock performance, track conditions, and infrastructure wear using sensor and IoT data with severity-based color coding.
Predictive Maintenance
Use AI-driven analytics to identify wear trends and anticipate component failures, highlighting high-risk areas for intervention.
Historical Analysis
Identify recurring failure hotspots and long-term degradation patterns. Combine maintenance history with failure data to refine strategies.
Impact Analysis
Overlay asset health data with service performance to reveal how infrastructure conditions contribute to delays and inefficiencies.
Integration of External Geospatial Datasets
Enhance analysis with external sources like weather, flooding, and temperature to refine risk assessment and prioritize tasks.
Optimized Maintenance Scheduling
Move from reactive to predictive maintenance by using real-world asset data to optimize scheduling based on location.
Delay Attribution Analysis
UK train operating companies collectively paid £138.6 million in passenger compensation under the Delay Repay scheme in 23/24. (gov.uk)
Enhancements in sub-minute data availability via Quartz or GPS tracking enable deeper analysis of the root causes of delays. Combine cloud-native geospatial formats with the latest GPU-enhanced visualization frameworks to unlock insights for proactive delay management.
Realtime Monitoring
Track network performance and highlight delays as they occur with severity-based color coding and proactive alerts.
Attribution Disputes
Generate a complete visual timeline of delays by overlaying contributing factors and replaying delays minute by minute.
Historical Analysis
Identify recurring delay hotspots and patterns to target improvements while assessing high-risk areas such as trespassing and flood-prone zones.
Impact Analysis
Overlay passenger data to assess the cost impact of delays, estimating potential vs. actual compensation costs.
Scheduling Analysis
Identify scheduling issues such as tight train spacing that increase the risk of knock-on delays.
Attribution Automation
Use AI-enhanced processes to analyze patterns and automatically attribute delays, highlighting potential dispute cases.
Why Choose Icon Map?
Our customer success stories
Bringing Malaria Data to Life: How MCD Global Health Uses Icon Map Pro to Power Field Decisions in Equatorial Guinea
MCD Global Health is a public health nonprofit headquartered in Maine, working across more than 50 countries to design and implement health programmes that genuinely change lives. Their international work spans malaria, cervical cancer, health systems strengt…
Enhancing Fiber Deployment and Commercialization with Icon Map Pro at Orange Concessions
Orange Concessions is the leading public-private fiber network operator in rural France. Through long-term public service delegation contracts, it manages a rapidly expanding network infrastructure designed to bring high-speed broadband access to underserved…
Transforming Rail Safety: The Power of Location Intelligence in Action at SNCB
Safety is a cornerstone of SNCB’s operational strategy. As Belgium’s national railway operator, SNCB places significant emphasis on the safety and security of both passengers and staff. CEO Sophie Dutordoir recently stated that all employees' work "deserves r…
Optimizing Christmas Eve: How Santa Uses Icon Map to Put Every Child on the Map
North Pole Logistics is the exclusive global operator responsible for delivering presents to children who celebrate Christmas. Operating from a single distribution center at the North Pole, the organization must reach more than 900 million homes in one extend…