


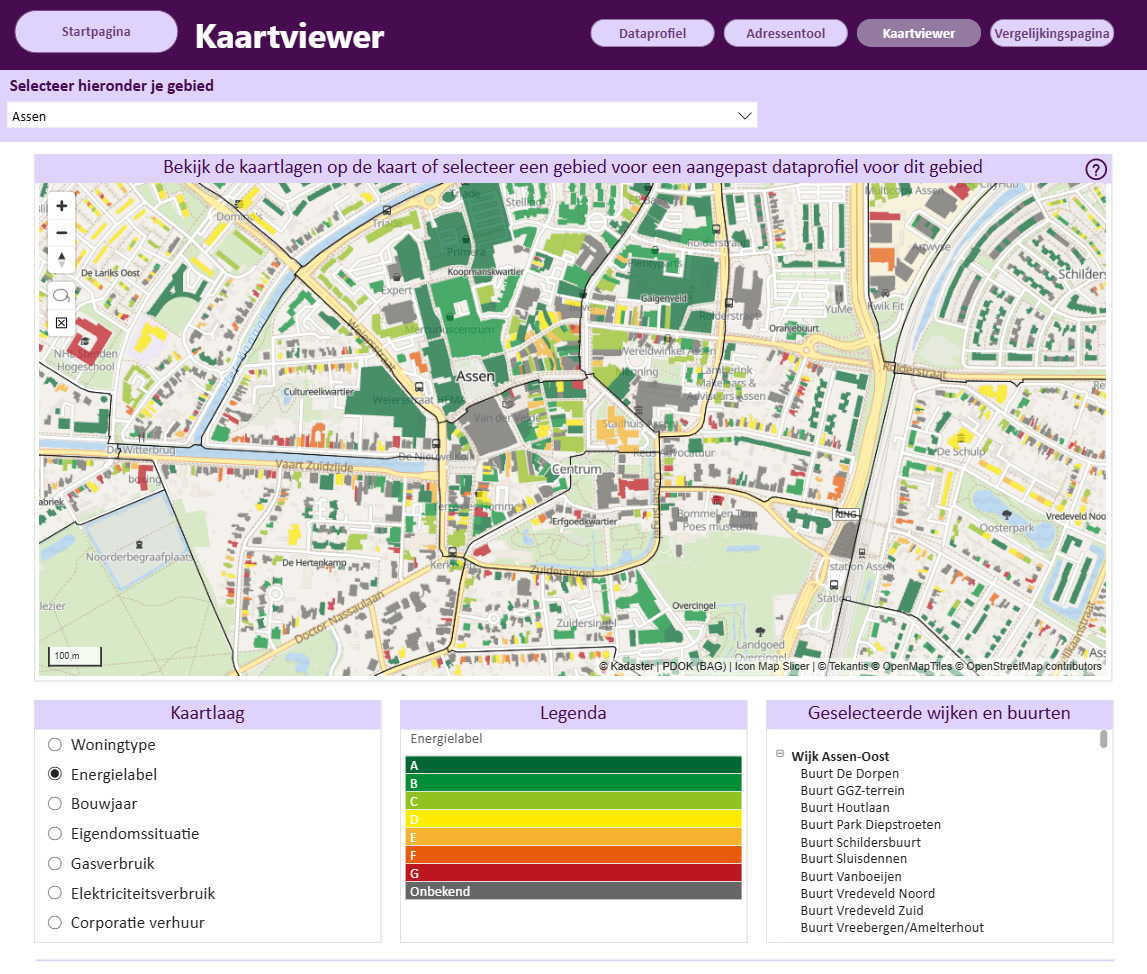
Turning Every Building in Drenthe Into a Filterable Energy Map
For the Province of Drenthe, seeing energy data building by building opens up a much clearer picture of what is happening on the ground.

Mapping for security-conscious organizations.
Everything runs inside the visual, down to street-level basemaps stored in the report.
Made for security-conscious organizations
Icon Map Lite is built for organizations where only certified Power BI visuals are allowed. It makes no network requests and asks for no permissions, so the map, your data and your uploads all stay inside the report. And it brings something rare to self-contained mapping: street-level basemaps of the places you report on, made in a few clicks with our free Basemap Builder and stored in the report.
No network requests, no external services and nothing to allow-list. Your data, uploads and selections stay in the report.
Roads, buildings and points of interest for your area, made in the free Basemap Builder and stored in the report.
Seven themes, place names in five languages and fourteen detail switches for country and global reports.
Click, lasso or circle the map and every visual on the page follows.
Street-level basemaps
For local reports, swap the built-in world map for a street-level basemap of your area. Make it in the free Basemap Builder on our website and upload it to the visual: roads, buildings, rail, paths and points of interest are stored right inside the report, with no tile server to reach.
The built-in basemap
This is Icon Map Lite's built-in basemap, exactly as a report draws it, designed for country, regional and world maps. Pick one of seven themes, switch the place names to another language, and turn layers of detail on and off.
Place names follow the report's language automatically, and the High contrast theme switches on with Windows high contrast.
Live maps, not screenshots
Each map below is live and drawn on Icon Map Lite's own basemap. Pick a layer type to see what it draws and which Power BI fields drive it.
Bind a measure to Circle Size and a category to the color, and every point tells its own story. Size in pixels or in real-world meters, with outlines, labels in seven styles and hatched fills.
1,500 cities from Natural Earth, sized by population and colored by continent.
Thousands of points gather into donut, pie, bar, column, square or teardrop clusters that show the mix inside. Add a second category for a second ring, and zoom in to break them apart.
The same 1,500 cities, grouped by continent.
Show where activity concentrates, weighted by any measure, with a gradient in your own colors.
500 wildfire detections around the Mediterranean from NASA FIRMS (VIIRS, 18 to 25 September 2026), weighted by fire radiative power.
Aggregate points into H3, S2, A5 or Geohash cells with sum, count, average, min or max, raise them in 3D, or count points into your own uploaded shapes.
City populations summed into H3 cells at resolution 3. Hold right-click or Ctrl and drag to tilt.
Draw every origin and destination as a curved arrow whose width follows your measure. Arrows bow to one side, so flows in each direction stay apart, and they can taper, carry value labels and filter the report.
A global electronics supply chain, from factories to regional hubs and on to markets. Arrow width follows containers per week (illustrative data).
Countries, their states and provinces come built in: join your rows by name or ISO code and the map colors itself, on a flat map or a globe. Or bring your own shapes as WKT or GeoJSON, or upload GeoJSON, TopoJSON, KML, shapefiles, IMDF indoor maps and PMTiles.
Natural Earth countries, colored by GDP per person (2019 estimates). Drag to spin the globe.
Raise a square or round column at every point, with height in meters or relative to your measure, lit by the map's own light and sky.
Asia's 361 cities of more than a million people (GeoNames). Column height and color follow population.
Stack as many layers as your story needs. Here a country choropleth, 3D city columns, an airline network and labels share one spinning globe, each styled on its own. Report readers switch layers on and off with the layer control, and every one of them filters the report.
Natural Earth countries colored by GDP per person (2019), the 250 largest cities by population, and Air France's long-haul network from Paris Charles de Gaulle (Eurostat, 2024). Drag to spin the globe, and switch layers in the legend.
Turn any label into a card with a title, body text, an image and a footer, each one bound to a field. Choose frosted glass that blurs the map behind it, dark glass, a solid card or neon, with a callout pointing at its feature, and show labels always, on mouse over or only for the selected items.
Downtown Manhattan's 5,436 buildings from Overture Maps, uploaded as PMTiles, colored by NYC PLUTO land use and raised to their height, over a street-level basemap of Lower Manhattan. Photos from Wikimedia Commons (CC0 and public domain). Switch the label style at the top left of the map.
Six ways to select
A selection on the map filters every visual on the page, the same way a slicer does, and it stays put while people click around the rest of the report. The map keeps showing everything, with the unselected items faded. Try each tool below: it is a working report, with a street-level basemap of central London uploaded.
Click an incident on the map to select it. Hold Ctrl or Shift to add more, and click the background to start again.
Press on the map and draw around the area you want. Everything inside the lasso is selected.
Press where you want the center and drag out the radius. The distance shows on the map as you drag, just as it does in the visual.
Click a borough. Everything inside that boundary is selected. In the visual, any polygon layer from your own files can work this way.
Click an incident to select everything within the buffer around it.
Pan and zoom. The report shows only what is on screen, and follows the map as it moves.
Add more report pages and Power BI's Sync slicers keeps this selection in step across all of them.
Incident data in this example is simulated. Borough boundaries: Office for National Statistics, Open Government Licence.
Built for Power BI
Build in Power BI Desktop and share through the Power BI service, with the map ready the moment the report opens.
Icon Map Lite makes no network requests of any kind and asks for no permissions. Your data, uploads and selections stay in the report.
Upload GeoJSON, TopoJSON, KML, zipped shapefiles, IMDF indoor maps and PMTiles, as data layers or reference layers.
Switch to a 3D globe, tilt up to 85 degrees, and set the light and sky that shade columns, hexagons and extruded shapes.
Load up to 480,000 rows into a single visual and aggregate them on the fly into hexagons, grids or your own shapes.
The visual and its place names follow your report in English, German, Spanish, French and Portuguese.
Keyboard selection, a high contrast theme that switches on with Windows high contrast, and legends built from your actual styling.
Buy per user through Microsoft Marketplace, with a free one-month trial and no license key to manage.
The Icon Map family
For live basemaps from ArcGIS and Azure Maps, the Icon Map Catalog, travel-time selection and 3D terrain, Icon Map Pro and Icon Map Slicer bring the full Icon Map experience.
The most capable mapping visual for Power BI: every layer type, every basemap, ArcGIS and the Icon Map Catalog.
Learn moreThe same depth of mapping, with the map acting as a slicer that drives the whole report page.
Learn moreA real map built into the visual, with street-level detail by upload and a map that filters the report.
Interactive maps built directly on your OneLake data, as a first-class Microsoft Fabric workload.
Learn moreOur customer success stories
For the Province of Drenthe, seeing energy data building by building opens up a much clearer picture of what is happening on the ground.

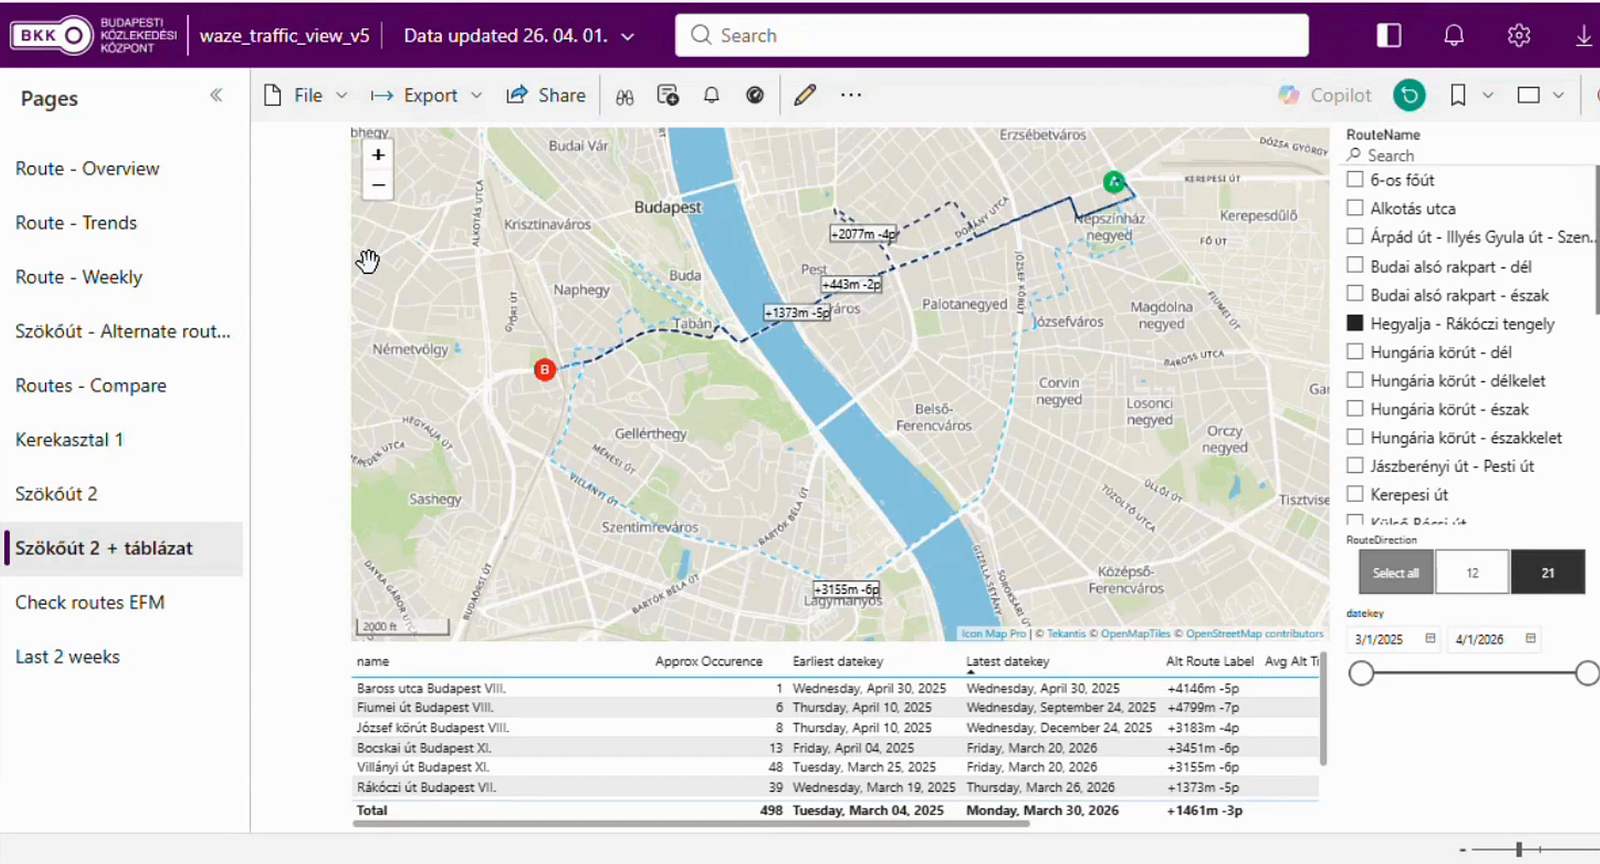
BKK, the Centre for Budapest Transport, is the organization behind the trams, buses and trolleybuses that move people around Hungary's capital, and its remit reaches well past the vehicles themselves. It also coordinates the city's shared bikes and e-scooters…

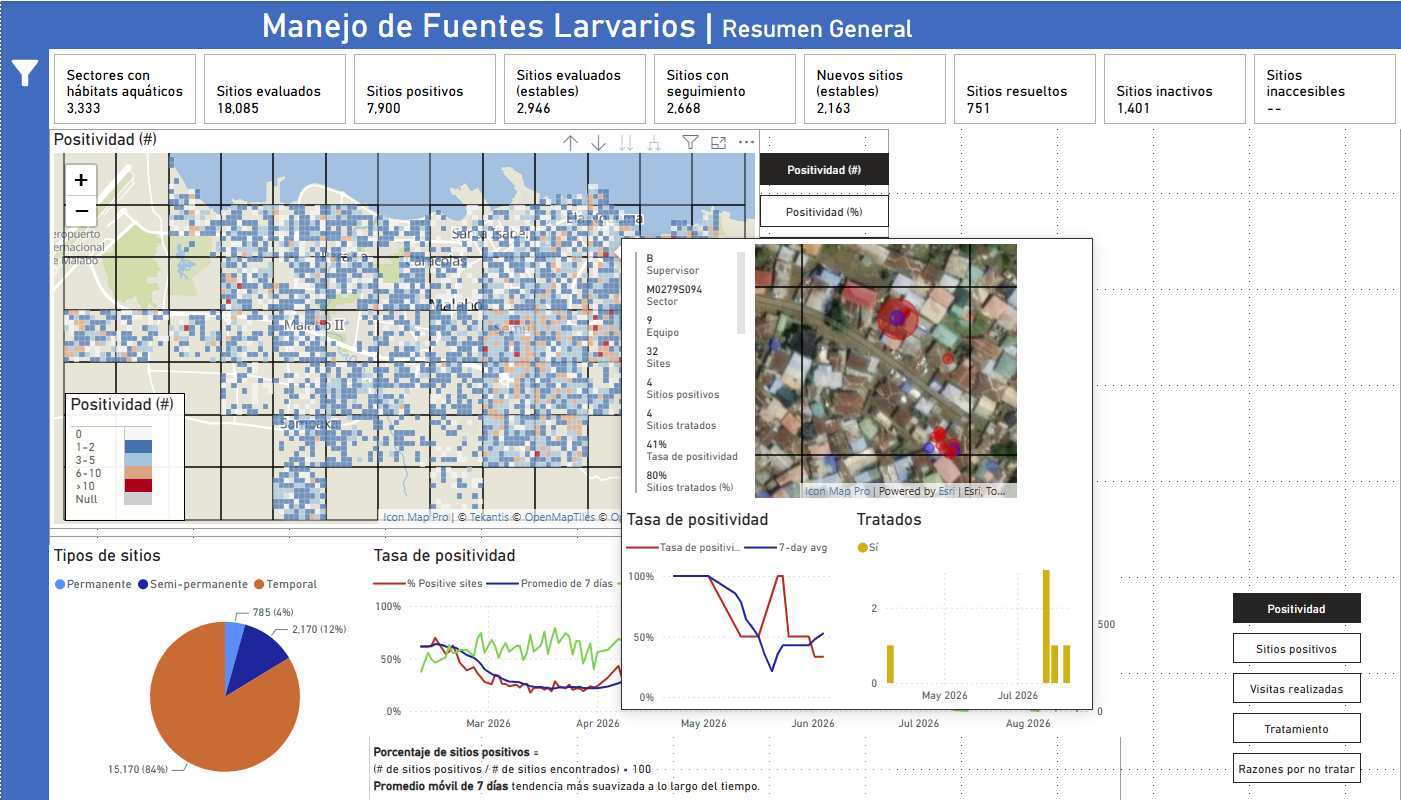
MCD Global Health is a public health nonprofit headquartered in Maine, working across more than 50 countries to design and implement health programmes that genuinely change lives. Their international work spans malaria, cervical cancer, health systems strengt…
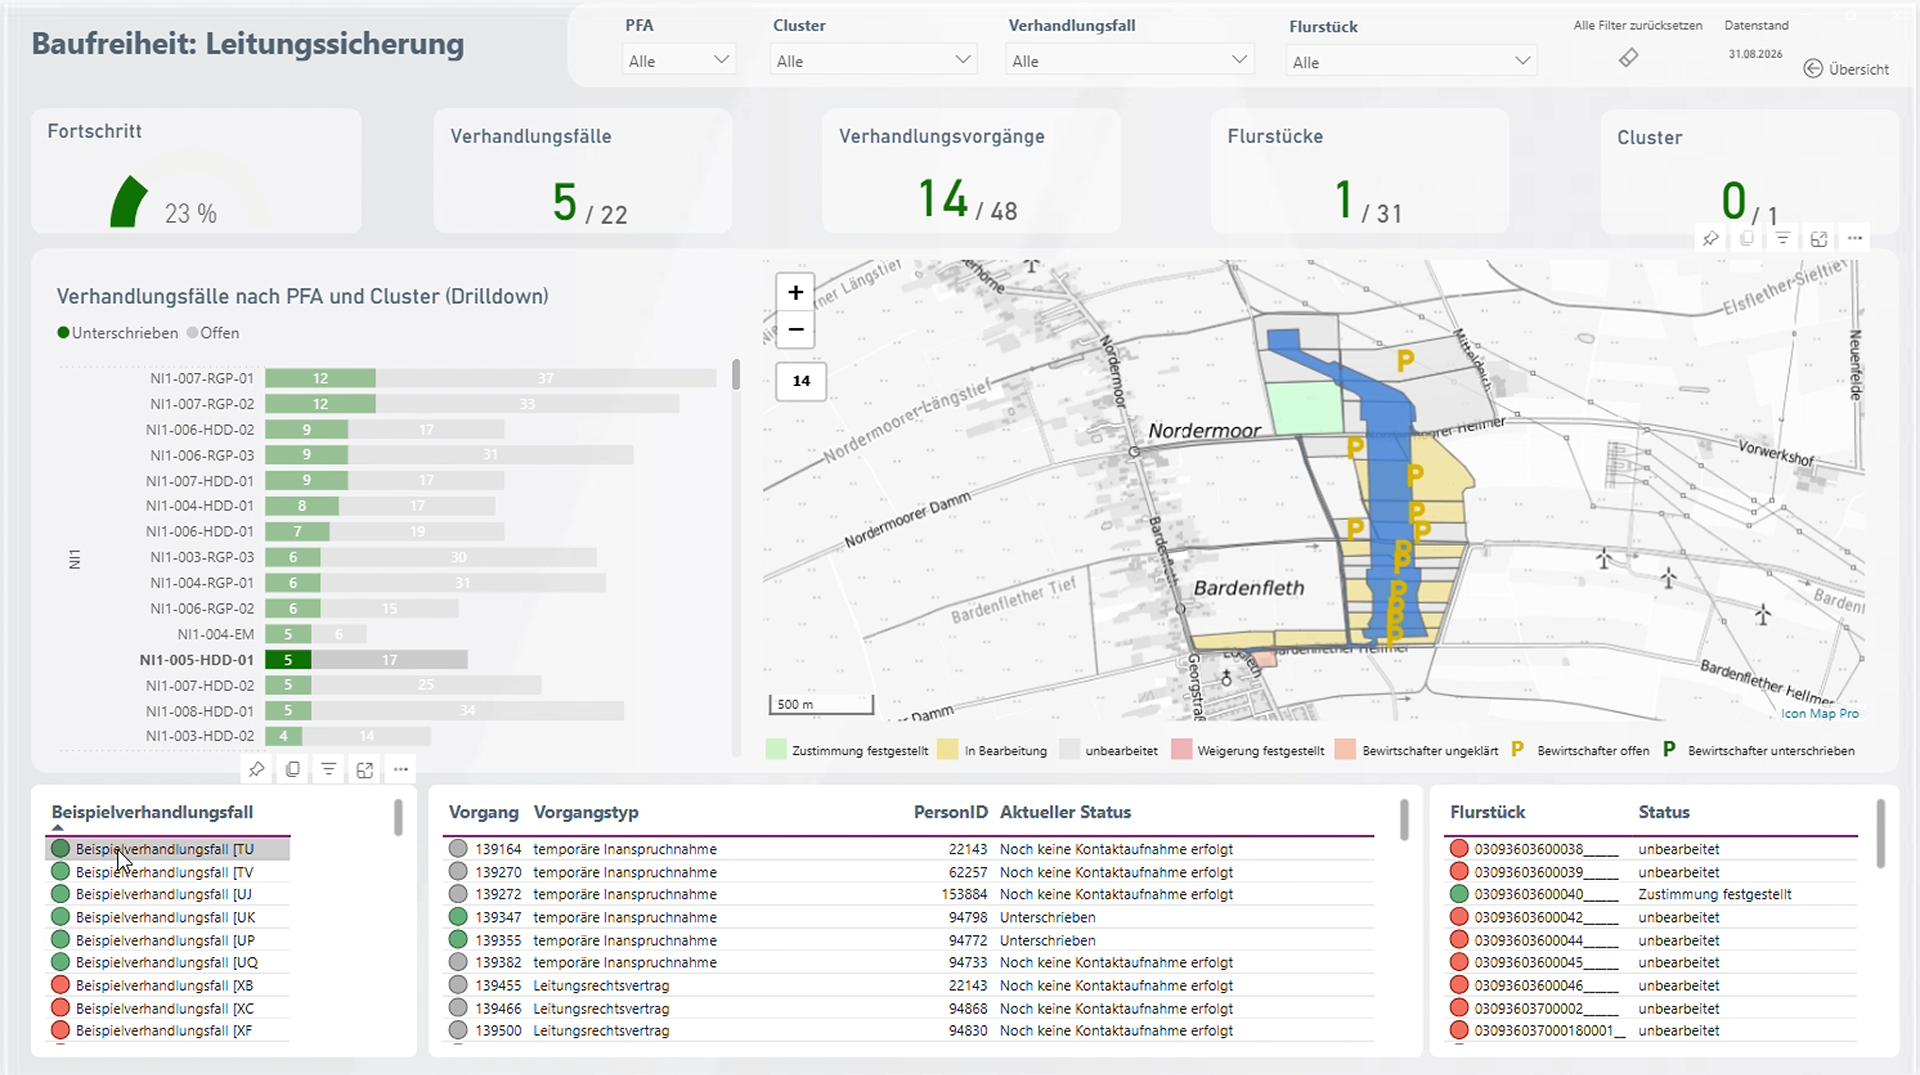
Amprion is one of Germany’s four transmission system operators, responsible for operating and expanding a critical part of Germany’s high-voltage electricity grid. Among its major infrastructure programmes is the Rhein-Main-Link, a planned underground HVDC c…


Orange Concessions is the leading public-private fiber network operator in rural France. Through long-term public service delegation contracts, it manages a rapidly expanding network infrastructure designed to bring high-speed broadband access to underserved…

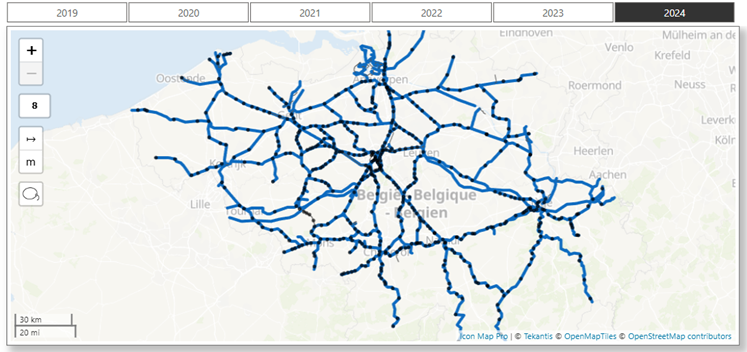
Safety is a cornerstone of SNCB’s operational strategy. As Belgium’s national railway operator, SNCB places significant emphasis on the safety and security of both passengers and staff. CEO Sophie Dutordoir recently stated that all employees' work "deserves r…
Add Icon Map Lite from Microsoft Marketplace and start a free one-month trial, then build a street-level basemap for your area in a couple of minutes.